
Design
Complex data systems
Research
In-app Purchase Report Suite
Design
Research
Complex data systems
Design
Research
Complex data systems
An all-in-one report suite with valuable market data
The In-app Purchase Behavior report suite is a powerful reporting tool designed to decode in-app purchases, offering key insights into user spending patterns. From casual users to high spenders, this tool empowers businesses to optimize their strategies and drive revenue growth in the competitive mobile market.

Customer Research
"We need to track new versus returning revenue and cross-app purchases to anticipate trends in user interests and enhance retention."

"We want to optimize revenue by examining Average Revenue Per Paying User (ARPPU) and cross-app purchase behavior for targeted monetization."

“We want to deepen insights into share of wallet and wallet size metrics to better understand high-paying users in our games sectors.”
Client | "I want to" | 1st Priority Metrics | Wish List | Trial |
|---|---|---|---|---|
Scopely | Understand which IAP strategy may be working best:
|
|
| Yes |
OutFit7 | Understand user lifecycles in different markets:
|
|
| Yes |
JoyCastle | To perform revenue forecasting:
|
| No answer | Yes |
CrossField | Understand the In-app Purchase lifecycle:
|
| No answer | Yes |
Client interview matrix excerpt

"Our highest priority is to focus on reducing paid user churn and improving lifetime value by analyzing spending patterns and engagement."

“Our goal is to enhance paying user retention and share of wallet by understanding user preferences across apps and maximizing SKU performance.”
Creative problem solving with business imperatives in mind
Synthesizing research and developing a first product concept
Through initial research and delineation of our business imperatives, we determined that the most successful and cost-effective implementation of this new SKU involved integrating Nielsen's new data set across multiple existing products. These included our flagship reports and the new Dashboard system.

"We frequently analyze revenue distribution by user segments to optimize retention and drive targeted monetization efforts, but we don’t have a way to do it at a market level."
Creating a product that uncovers new monetization opportunities
User research and customer validation provided the necessary feedback to forecast a $4.5M ARR opportunity, with the gaming sector having the highest revenue potential of $2.76M followed by other segments such as Financial Investments. I focused design and market research to extract the main user goals to pair with our intended business opportunities.
Resolving a major conflict with business goals in mind
During the design exploration phase we determined that this approach was not attainable, as the UDW/ETL Engineers and Data Science could not reconcile the data mapping between Nielsen’s partnership and data.ai’s own sources without causing a major loss in data reliability.
Designing a robust report system to handle a variety of complex use cases
A large effort during the design process of this project involved building complex information architecture maps to account for and optimize all of the dimensions, breakdowns and filters relevant to our target use cases.
Scopely Usecase sample
"I'm interested in getting into a new gaming sector and understanding which players drive the most monetization"
01
I need to refine my analysis to target the relevant market segment


02
I need to identify a group of apps with high-conversion customers who have significant wallet sizes, maximizing spending potential.
03
I want to further understand these apps performance by analyzing their Average Revenue per Paying User (ARPPU)


04
This group of apps is great per my criteria. Now I need to analyze what are the most successful monetization strategies they use

Project Workstreams
Designing as part of a task force
I worked closely with a team of experienced contributors from across the organization. Our goal was to fast-track a new product SKU with time-sensitive deliverables and ensure a strong ROI on our partnership investments.
When is it important to build full prototypes?
It's Playtime

Given the complexity of this report system, I developed a detailed prototype to gather customer feedback during usability interviews. This prototype also helped effectively communicate the design and scope to company leadership and served as a key reference for Front-End engineering, detailing the implementation of UX systems and visualizations.
Using lateral thinking to come up with imaginative solutions
Quickly pivoting our strategy, I decided to step back and re-evaluate our initial research on user goals and business objectives. After collaborating closely with the PM, I determined that the clearest path forward was to isolate this data set within its own report suite. I then designed new interaction systems to support a wide variety of use cases that aligned more closely with achieving a higher ROI.


Dimensions and Breakdowns
Apps
Start your analysis by viewing the top app players in the U.S. market and dive in deeper by selecting app store categories or data.ai exclusive industry taxonomies
Classifications
Analyze all major app industries by app store or data.ai classifications
IQ Tags
Use the most extensive set of feature classifications, revenue, advertising strategies or game mechanics to analyze the market.
Bringing forward all the key visualizations
Top Performers
Start your analysis by viewing the top app players in the U.S. market and dive in deeper by selecting app store categories or data.ai exclusive industry taxonomies
Cohort Analysis
Analyze all major app industries by app store or data.ai classifications
Cross-Purchase Overview
Use the most extensive set of feature classifications, revenue, advertising strategies or game mechanics to analyze the market.
Purchasing 3D Insights
Use the most extensive set of feature classifications, revenue, advertising strategies or game mechanics to analyze the market.


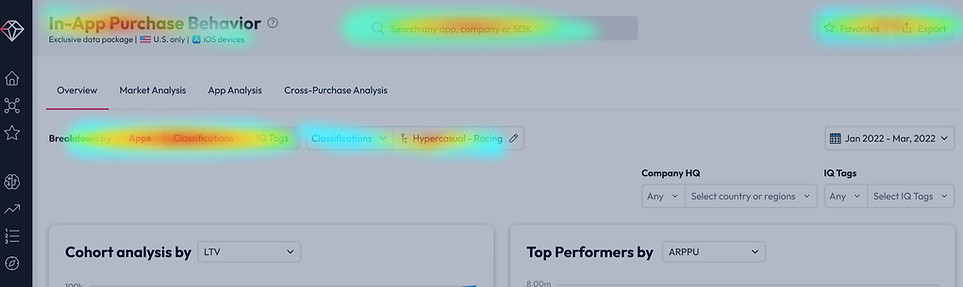
Powerful high-level report with all key insights in one place
The Overview System


Design Highlights
Design execution through the project lifecycle
I worked through each stage of the design process, collaborating closely with the taskforce to align efforts across design, product, and engineering teams. From defining early concepts and prototypes to usability testing and final validations, every step was synchronized with the broader project goals.
Project Summary
This project expanded data.ai's offering with a new report suite powered by partnered datasets. As part of a task force of experts, I tackled the project's complexity and compressed timelines, delivering a cohesive, user-friendly, and impactful report system.
ROLE | TIMEFRAME | TEAM |
|---|---|---|
Principal Designer, Researcher | Q4 2022 - Q1 2023 | 8 Disciplines, 13-16 people |
Design Processes
Rapid Prototyping
HiFi Prototyping
User Flow Mapping
Advanced Data Mapping
Concept Mapping
Cross-disciplinary workshops
Tools Used
Figma
Pendo.io
Miro
Spreadsheets
Presentation Decks
Tableau
Asana
Jira
Research Methodologies
Team
Market Analysis
Competitive Analysis
Personas
User Research
Usability Interviews
Surveys
Journey Mapping
Data Acquisition Lead
Parnership Director
Principal Project Manager
Sr. Service Integration Engineer
Lead Data Scientist
Senior TPM
Front-end Engineer Manager
Senior Front-end Engineers
UDW/ETL Engineers
Principal Product Designer
Project Specifications
ROLE | TIMEFRAME | TEAM |
|---|---|---|
Principal Designer, Researcher | Q4 2022 - Q1 2023 | 8 Disciplines, 13-16 people |


Dimensions and Breakdowns
Apps
Start your analysis by viewing the top app players in the U.S. market and dive in deeper by selecting app store categories or data.ai exclusive industry taxonomies
Classifications
Analyze all major app industries by app store or data.ai classifications
IQ Tags
Use the most extensive set of feature classifications, revenue, advertising strategies or game mechanics to analyze the market.
Bringing forward all the key visualizations
Top Performers
Start your analysis by viewing the top app players in the U.S. market and dive in deeper by selecting app store categories or data.ai exclusive industry taxonomies
Cohort Analysis
Analyze all major app industries by app store or data.ai classifications
Cross-Purchase Overview
Use the most extensive set of feature classifications, revenue, advertising strategies or game mechanics to analyze the market.
Purchasing 3D Insights
Use the most extensive set of feature classifications, revenue, advertising strategies or game mechanics to analyze the market.
Design Highlights
Target User
This project expanded data.ai's offering with a new report suite powered by partnered datasets. As part of a task force of experts, I tackled the project's complexity and compressed timelines, delivering a cohesive, user-friendly, and impactful report system.
KPI's
This project expanded data.ai's offering with a new report suite powered by partnered datasets. As part of a task force of experts, I tackled the project's complexity and compressed timelines, delivering a cohesive, user-friendly, and impactful report system.
KPI's
This project expanded data.ai's offering with a new report suite powered by partnered datasets. As part of a task force of experts, I tackled the project's complexity and compressed timelines, delivering a cohesive, user-friendly, and impactful report system.